
 Today’s ACT question of the day involves a sort of homemade sundial. A student (who must not have internet access or who has broken his iPhone) has placed a stick in the ground and measured the length of its shadow at certain times of the day.
This stick-shadow data is presented in two tables:
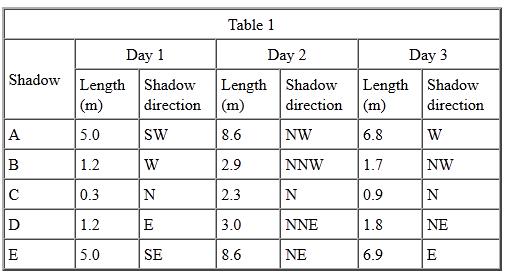
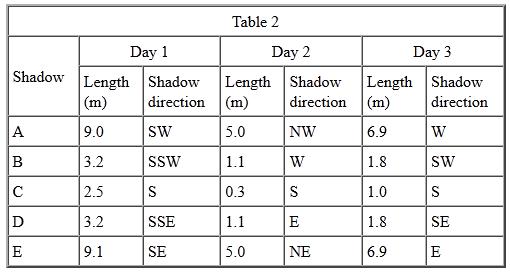
We are asked to choose a chart that reflects the stick’s length from sunrise to sunset. In all 6 examples (days 1-3 in both charts), the shadow starts out long, gets smaller, then lengthens again. Our graph must look like a V or a parabola.
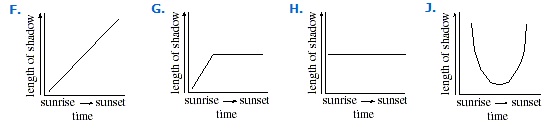
J looks like a winner! If you weren’t sure what to look for in the charts, remember that the question asks about length – so we need a column with units that make sense for length (like meters). The times are given as A through E in the chart, but the text explains that those time refer to sunrise, noon, sunset, etc. … a little reading can go a long way.